The research was co-led by Senior Data Scientist, Huiting Ma, and funded by the Canadian COVID-19 Immunity Task Force and Canadian Institutes of Health Research. This paper is published in Open Forum Infectious Diseases.
Why did we conduct this study?
Economically marginalized communities have faced disproportionately higher risks for infection and death from COVID-19 across Canada. In Ontario, policies attempting to address health inequities were also temporarily implemented in the subsequent waves, including, temporary income support, eviction moratoria, 3-day paid sick leave, and geographic prioritization of vaccine eligibility and allocation. We used metrics of inequality (Lorenz curve and concentration/Gini coefficients) to characterize changes in the magnitude of concentration in COVID-19 hospitalization and deaths by neighborhood-level income among 14 million Ontario residents across five waves.
What did we do?
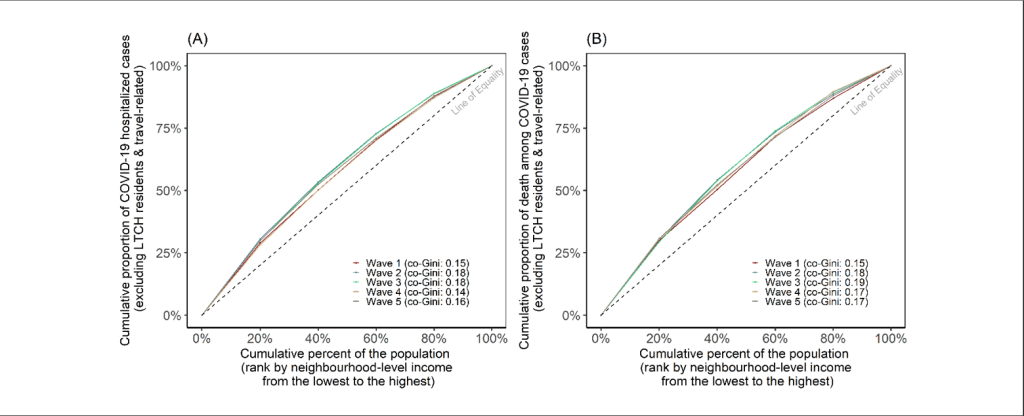
We generated Lorenz curves for outcomes (the number of individuals who were hospitalized or died following COVID-19 diagnosis) by DA-level income quintile and estimated the co-Gini coefficient (zero represents complete equality and one represents complete inequality) in each wave. We defined five waves as:
- Wave 1: February 26, 2020 to August 31, 2020 (length of wave: 188 days)
- Wave 2: September 1, 2020 to February 28, 2021 (length of wave: 181 days)
- Wave 3: March 1, 2021 to July 31, 2021 (length of wave: 153 days)
- Wave 4: August 1, 2021 to December 14, 2021 (length of wave: 135 days)
- Wave 5: December 15, 2021 to February 28, 2022 (length of wave: 75 days).
What did we find?
Over the study period, hospitalizations and deaths were concentrated among the 20% of the population living in the lowest income neighborhoods (Figure 1, Figure S1). The magnitude of inequality in hospitalization and mortality by income remained unchanged across waves (range in co-Gini, 0.14-0.19), despite less inequality by income in vaccination or known past infection.
What do these findings mean?
- Our findings indicate that interventions did not sufficiently address differential exposure risks amplified at the intersections of household crowding and size, workplace exposures, and systemic barriers to prevention and care (including access to therapeutics).
- Equality in intervention reach is often insufficient to redress longstanding inequities and overall reductions in cases and deaths are insufficient metrics of comparative success if existing health disparities persist.
- Equity and effectiveness of programs are inherently linked–and ongoing evaluation of both is central to inform the public health response to future waves of COVID-19 and other rapidly emergent pandemics.